> ## Documentation Index
> Fetch the complete documentation index at: https://docs.contexaai.com/llms.txt
> Use this file to discover all available pages before exploring further.
# Tracing and Logs
> Track all your server and tool calls in one place
The **Traces** tab in Contexa provides complete visibility into how your MCP servers and tools are being used. Whether you're debugging a failing tool, measuring usage trends, or just validating tool call outputs - **Traces** is the place to go.
All tool calls are automatically logged with rich metadata, making it easy to inspect input/output schemas, status, timestamps, and session history.
### Overview
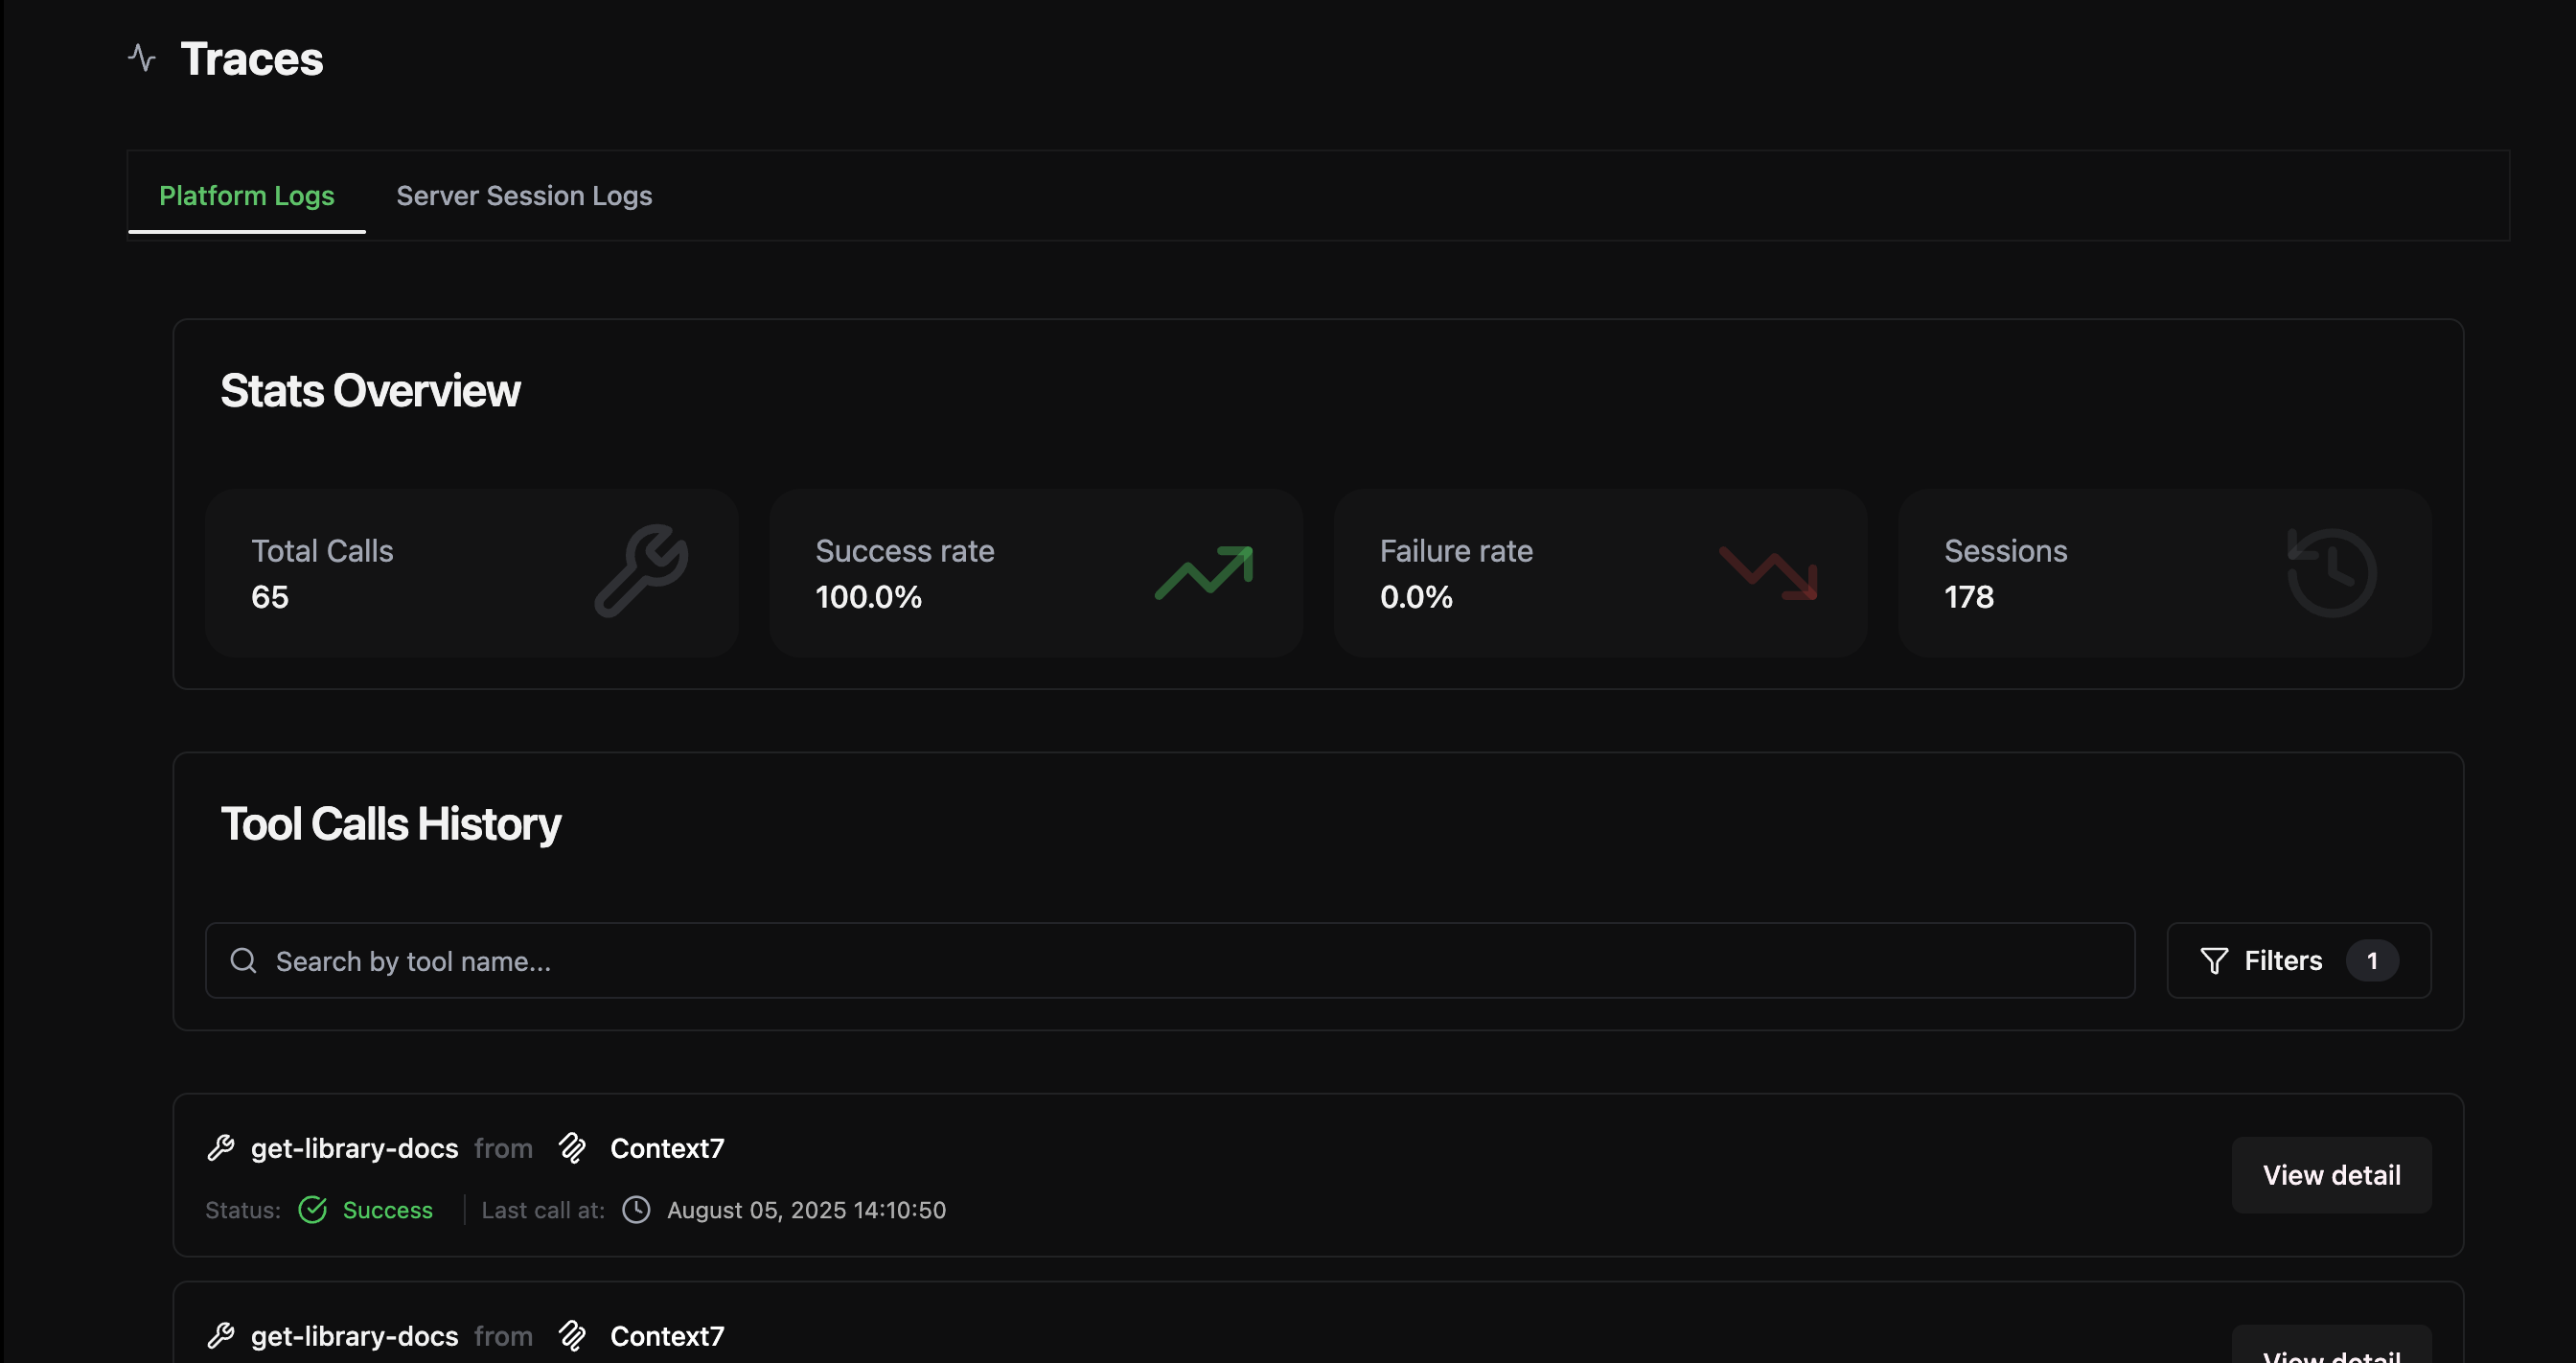
Click on the **Traces** tab from the sidebar to open the tracing dashboard. You'll find two main sections:
#### 🟢 Platform Logs
Shows all individual tool calls made across your deployed servers.
#### 📘 Server Session Logs
Groups calls by **chat sessions**, allowing you to trace the full flow of tool usage within a single conversation (ideal for multi-step agents or workflows).
 #### 📜 **Tool Calls History**
* A searchable, filterable list of all tool calls
* View includes:
* Tool name (e.g., `get-library-docs`)
* Status (Success / Failure)
* Timestamp
* Source MCP server
Clicking **“View Detail”** on any entry opens the full trace.
#### 📜 **Tool Calls History**
* A searchable, filterable list of all tool calls
* View includes:
* Tool name (e.g., `get-library-docs`)
* Status (Success / Failure)
* Timestamp
* Source MCP server
Clicking **“View Detail”** on any entry opens the full trace.
 ### Tool Call Detail View
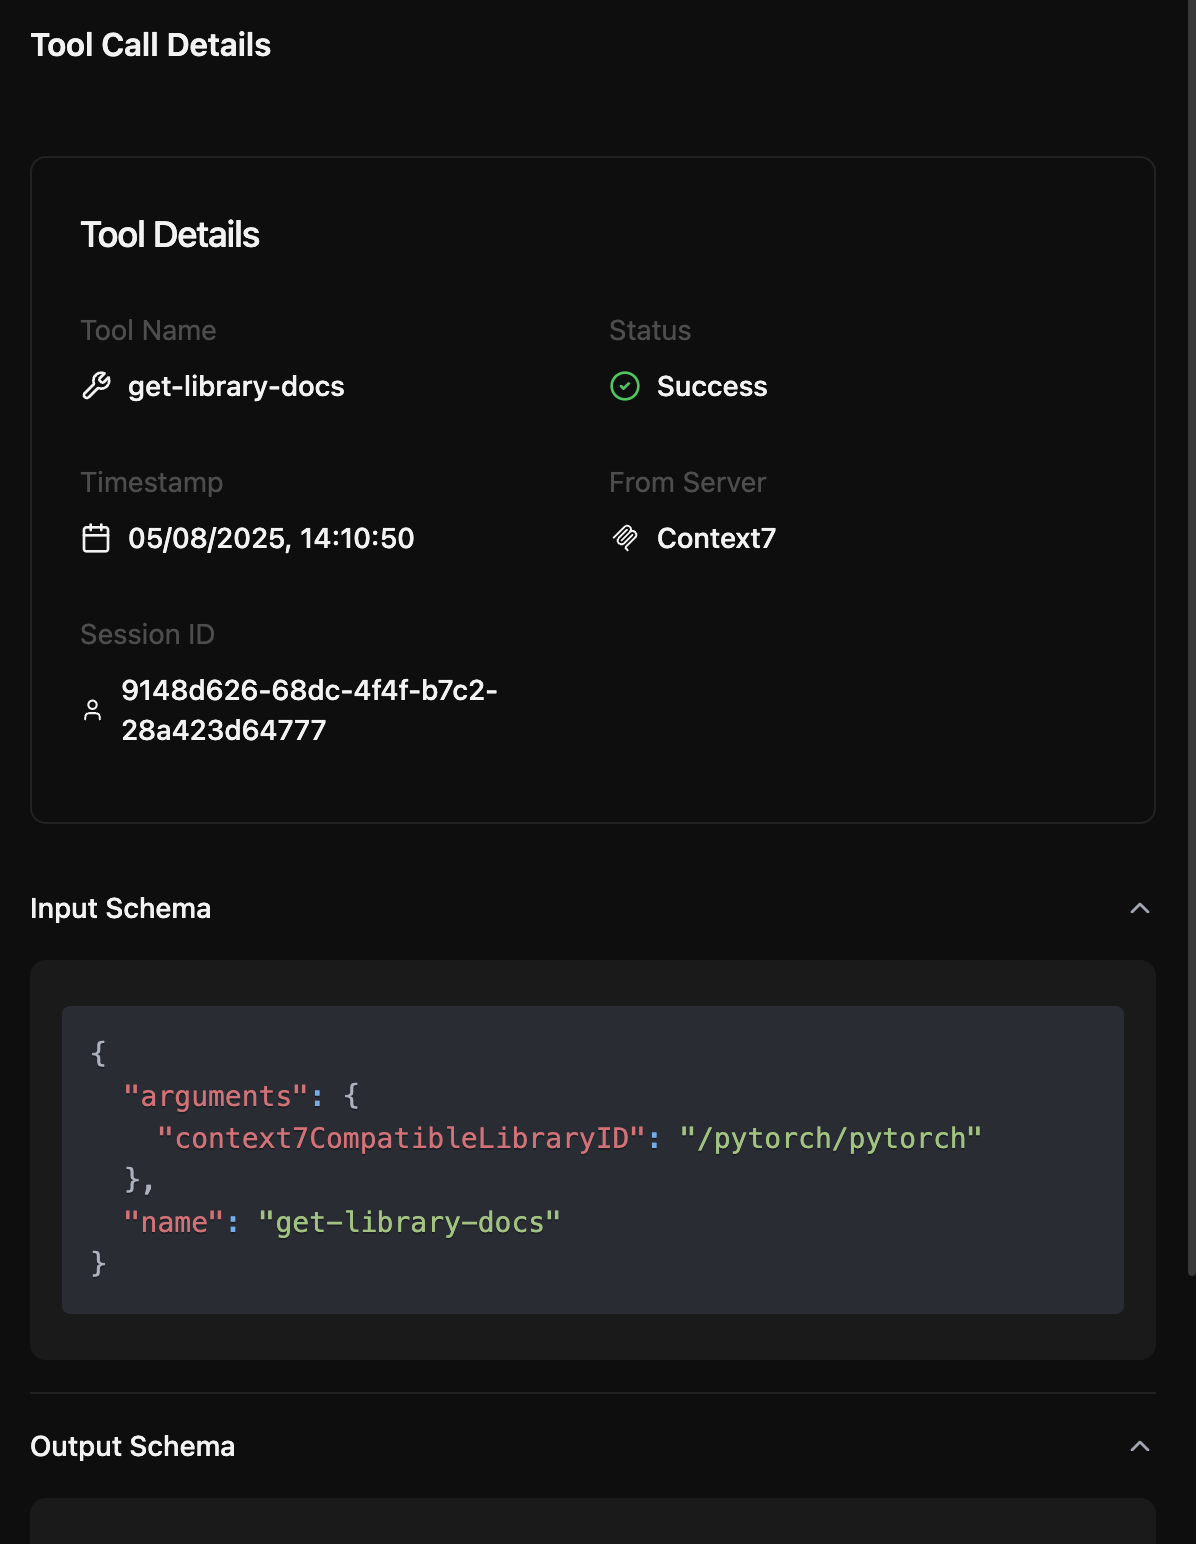
When you inspect a tool call, you’ll see:
* **Tool Name**
* **Call Status**
* **Timestamp**
* **MCP Server Source**
* **Session ID**
Along with:
#### 🔧 Input Schema
Shows the exact arguments sent to the tool, in JSON format.
#### 📤 Output Schema
Displays the tool’s response/output, if any.
This lets you validate that tools are being called correctly and returning expected results.
### Server Session Logs
The second tab, **Server Session Logs**, groups tool call traces by session ID. This is especially useful when:
* Debugging multi-step tool interactions by an agent
* Understanding the chronological flow of calls in a single chat
* Analyzing patterns in real-world usage
### Use Cases
* ✅ Debug tool calls in real-time
* 🔎 Inspect malformed inputs or failures
* 📊 Analyze success rates and usage patterns
* 🧵 Trace tool chains within a session
The Tracing section is your mission control for observability—whether you're shipping APIs, orchestrating custom tools, or managing high-traffic MCP servers.
### Tool Call Detail View
When you inspect a tool call, you’ll see:
* **Tool Name**
* **Call Status**
* **Timestamp**
* **MCP Server Source**
* **Session ID**
Along with:
#### 🔧 Input Schema
Shows the exact arguments sent to the tool, in JSON format.
#### 📤 Output Schema
Displays the tool’s response/output, if any.
This lets you validate that tools are being called correctly and returning expected results.
### Server Session Logs
The second tab, **Server Session Logs**, groups tool call traces by session ID. This is especially useful when:
* Debugging multi-step tool interactions by an agent
* Understanding the chronological flow of calls in a single chat
* Analyzing patterns in real-world usage
### Use Cases
* ✅ Debug tool calls in real-time
* 🔎 Inspect malformed inputs or failures
* 📊 Analyze success rates and usage patterns
* 🧵 Trace tool chains within a session
The Tracing section is your mission control for observability—whether you're shipping APIs, orchestrating custom tools, or managing high-traffic MCP servers.