Overview
Click on the Traces tab from the sidebar to open the tracing dashboard. You’ll find two main sections:🟢 Platform Logs
Shows all individual tool calls made across your deployed servers.📘 Server Session Logs
Groups calls by chat sessions, allowing you to trace the full flow of tool usage within a single conversation (ideal for multi-step agents or workflows).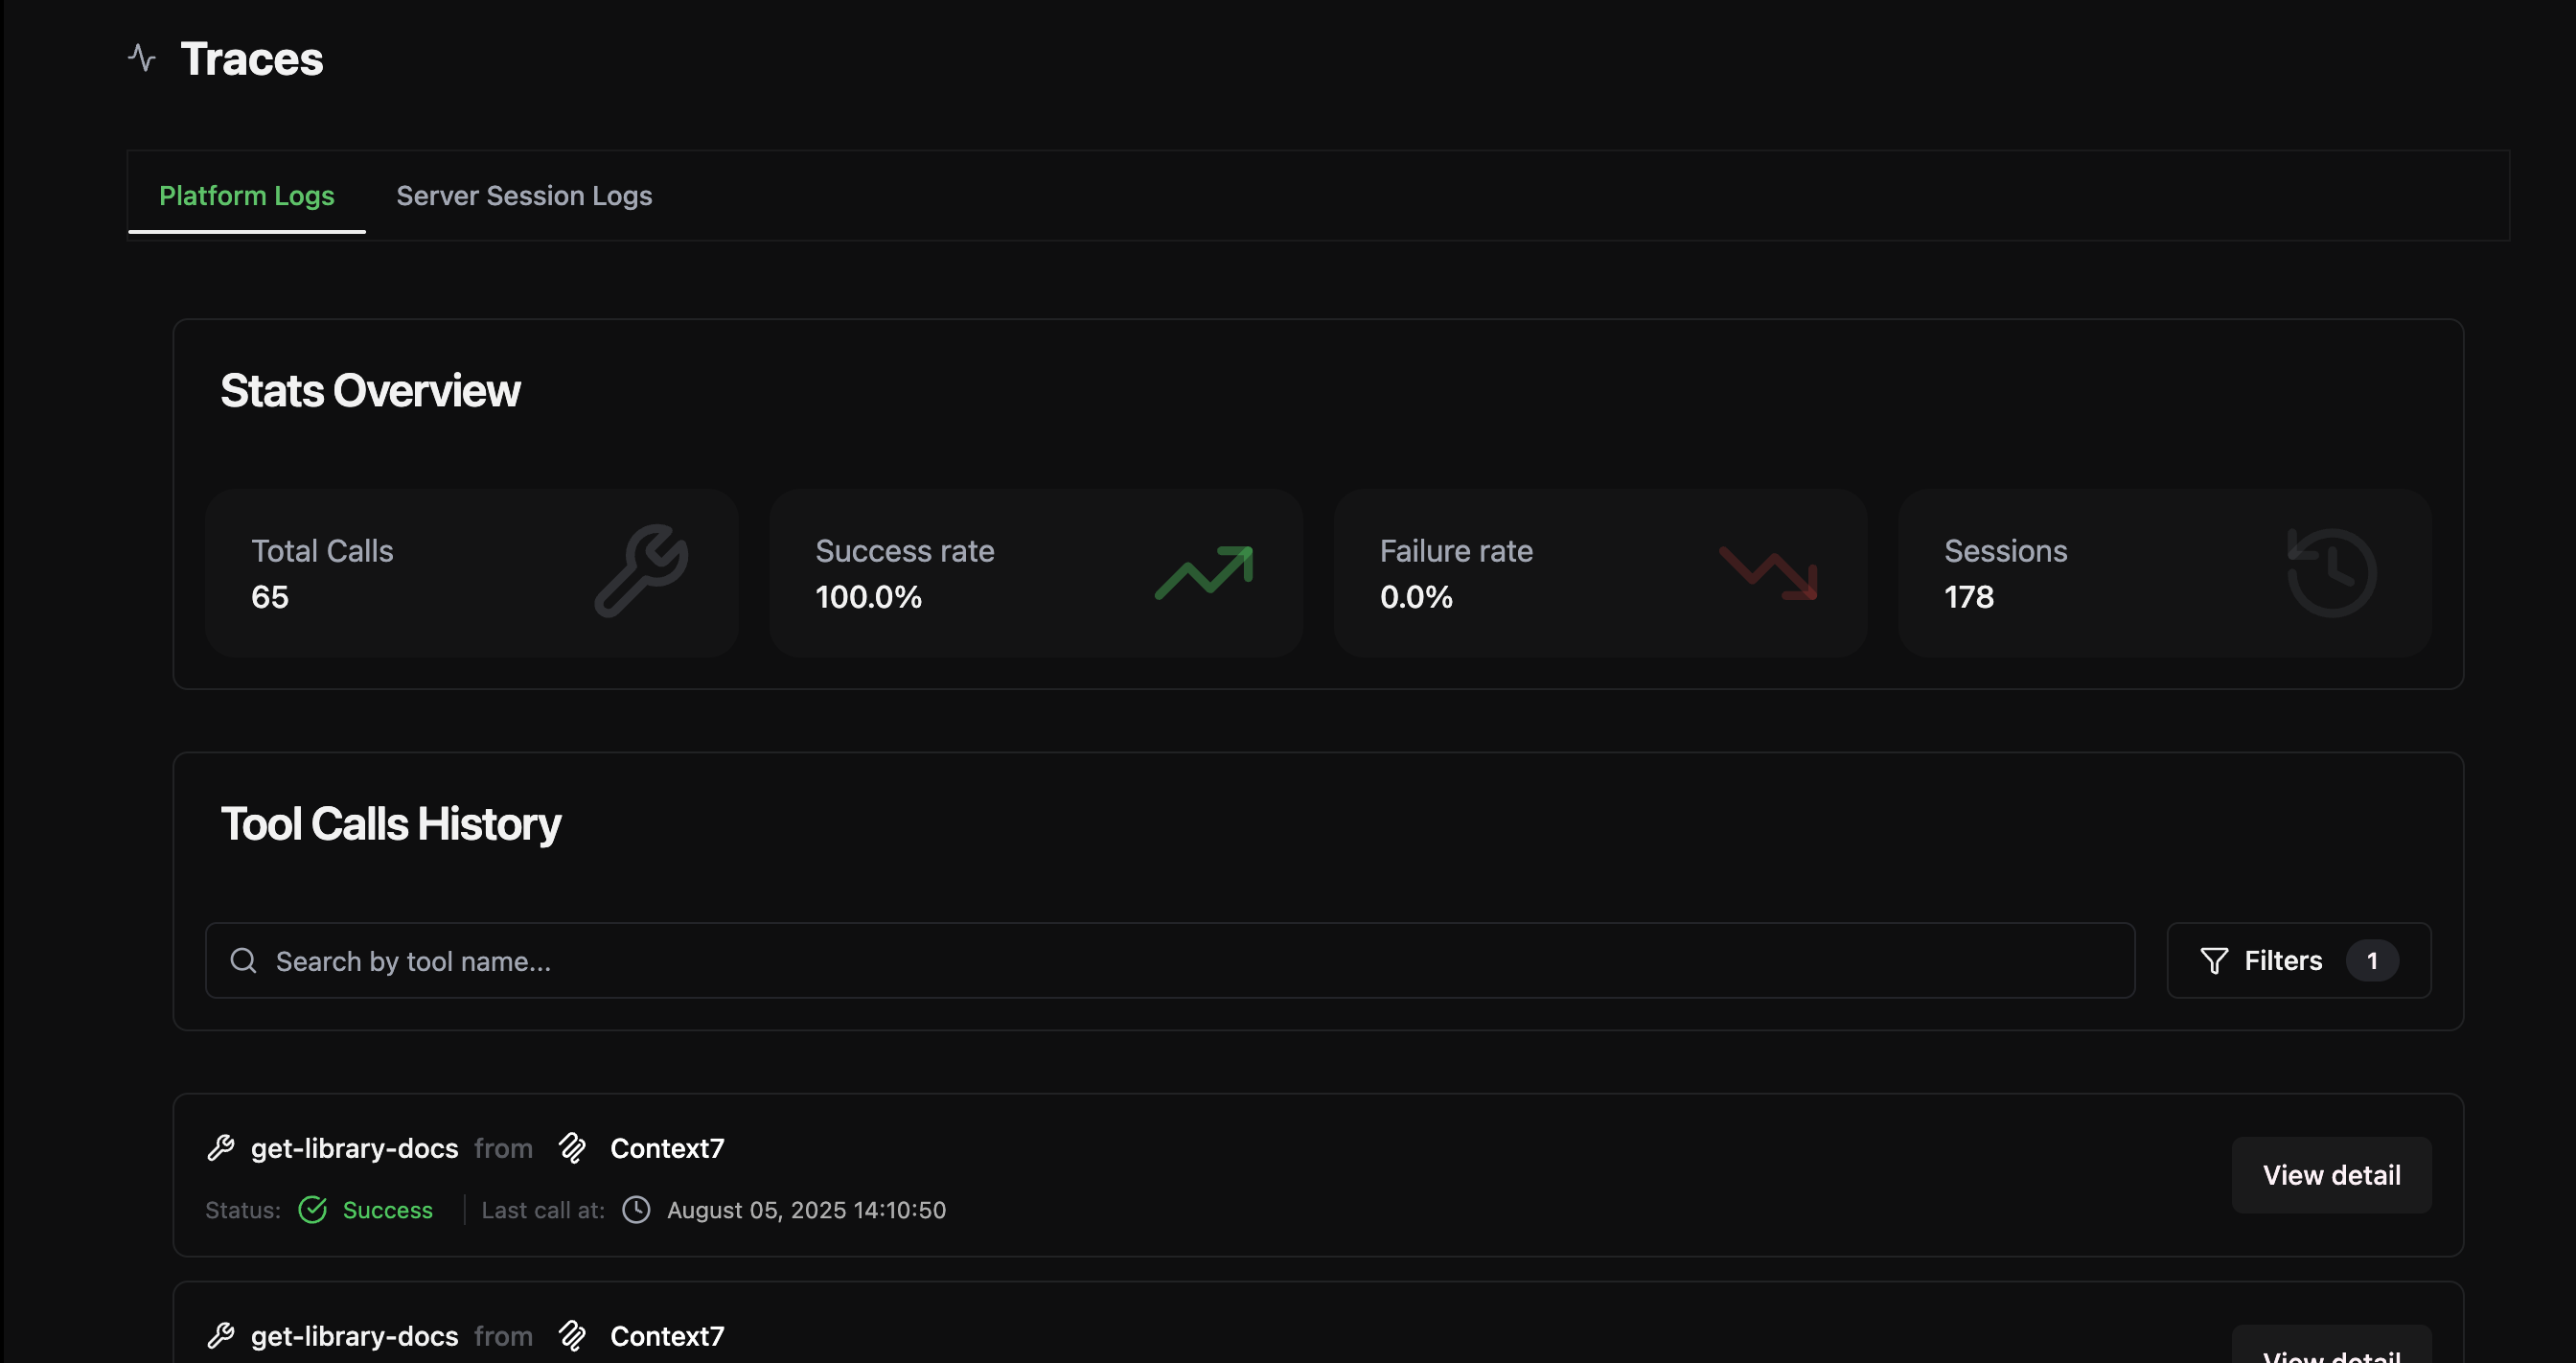
📜 Tool Calls History
- A searchable, filterable list of all tool calls
- View includes:
- Tool name (e.g.,
get-library-docs) - Status (Success / Failure)
- Timestamp
- Source MCP server
- Tool name (e.g.,
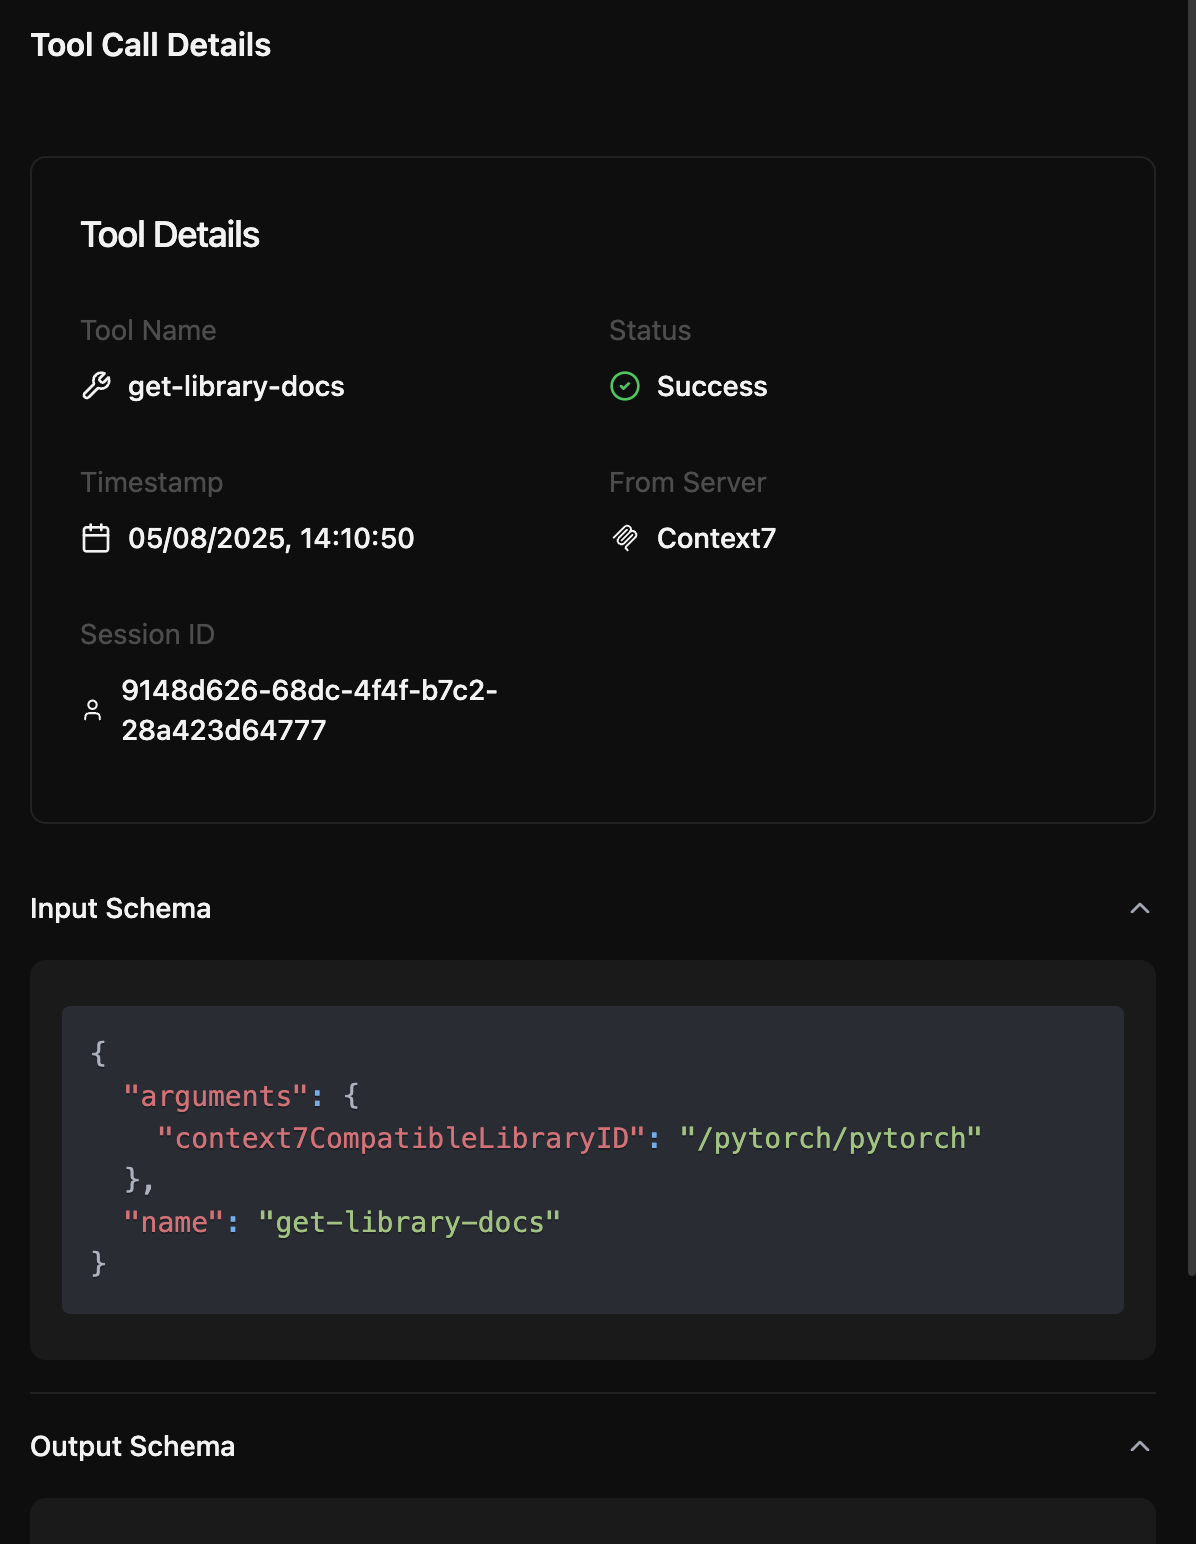
Tool Call Detail View
When you inspect a tool call, you’ll see:- Tool Name
- Call Status
- Timestamp
- MCP Server Source
- Session ID
🔧 Input Schema
Shows the exact arguments sent to the tool, in JSON format.📤 Output Schema
Displays the tool’s response/output, if any. This lets you validate that tools are being called correctly and returning expected results.Server Session Logs
The second tab, Server Session Logs, groups tool call traces by session ID. This is especially useful when:- Debugging multi-step tool interactions by an agent
- Understanding the chronological flow of calls in a single chat
- Analyzing patterns in real-world usage
Use Cases
- ✅ Debug tool calls in real-time
- 🔎 Inspect malformed inputs or failures
- 📊 Analyze success rates and usage patterns
- 🧵 Trace tool chains within a session
The Tracing section is your mission control for observability—whether you’re shipping APIs, orchestrating custom tools, or managing high-traffic MCP servers.